Meet the Debugger panel
Meet the Debugger panel
Ready to step up? The Debugger panel provides a much more comprehensive, interactive view than trace() of the inner workings of a SWF file. It enables you to see movie clips and nested movie clip hierarchies, text fields, object properties, variables, and more. It also enables you to pause individual lines of ActionScript code and step through them at your pace.
Rather than merely reacting to output in the Output panel, you can watch as an if statement evaluates its condition. You can witness the values of variables and properties change over time. In some cases, you can even alter their values yourself. In loop_3_times.fla, for example, you could have recognized the NaN error, made a note of it, and then manually changed NaN to 0 in order to verify the rest of the code.
To open the Debugger panel, select Window > Debugger or press Shift+F4 (Windows) or Option+F4 (Macintosh). Although you may open this panel at any time, it won’t actually do anything until you debug your SWF file by selecting Control > Debug Movie or by pressing Control+Shift+Enter (Windows) or Command+Shift+Return (Macintosh).
Like the Output panel, the Debugger panel is configurable through the Options menu, which you can access through the Options button in the upper right corner (see Figure 3). Options include zooming, quality settings, printing, and more.
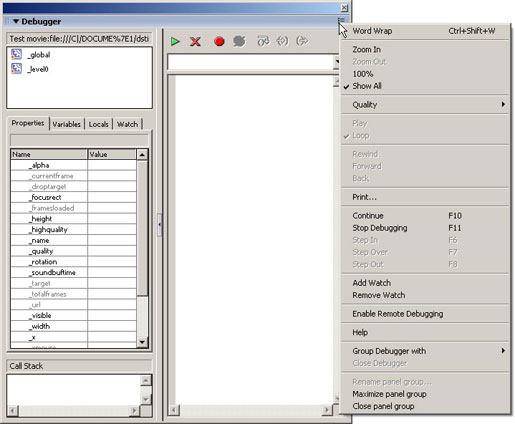
Figure 3. Options menu in the Debugger panel

To see the Debugger in action, follow these steps:
-
Open debugger_1.fla and select Control > Debug Movie. The first thing you’ll notice is that the SWF file begins in a paused state, waiting for you to click the green Continue button at the top of the Debugger panel (see Figure 4). The reason Flash waits is so that you may optionally set breakpoints in your ActionScript code. Don’t click Continue yet!
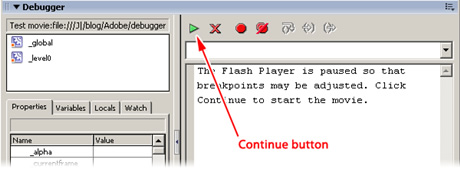
Figure 4. Continue button in the Debugger panel
Breakpoints are stop signs that cause the Debugger to halt during playback while you examine various aspects of the SWF file. In the Debugger panel, they appear as red bullets next to individual lines of code (look ahead to Figure 6). Flash conveniently remembers breakpoints even after you close the FLA file. New in Flash 8, breakpoints are also remembered for external ActionScript files, thanks to an automatically generated XML file, AsBreakpoints.xml.
-
A SWF file’s ActionScript code may exist in a variety of places, including Timeline frames, direct attachment to buttons or movie clips, and even external files brought in through the
#includedirective orimportstatement. In order to select which frame, object, or external file to inspect, click the pop-up menu below the Continue button (see Figure 5). You’ll notice that ActionScript code exists in two places in this file: attached to a button and in frame 1 of the Scripts layer.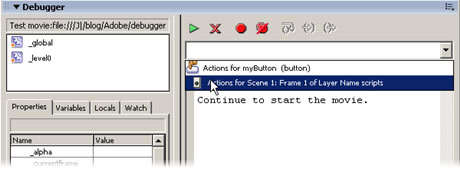
Figure 5. Script selection pop-up menu in the Debugger panel
-
Choose the code in frame 1 and set a breakpoint on line 34. To do so, you may either click in the gutter near line 34 or position your cursor in that line and click the Toggle Breakpoint button (see Figure 6).
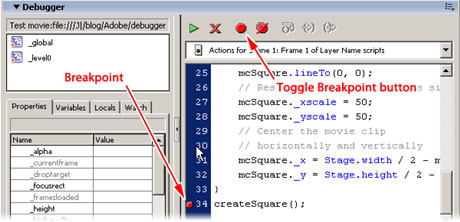
Figure 6. Setting a breakpoint in the Debugger panel
Note: You may also set breakpoints in a FLA file by clicking in the gutter of the Actions panel. In fact, in Flash 8 you can even set breakpoints in external AS files by clicking in the gutter of the Script window. Breakpoints make sense only when they appear next to executable lines of ActionScript. If a breakpoint is set on a commented or empty line, it will be ignored.
- After you set your breakpoint, click the Continue button. The SWF file will proceed as usual and stop cold at line 34, enabling you to investigate the current value of any variables and properties in the file at that moment.
-
Look to the left side of the Debugger panel. At this point, ActionScript has already created a new movie clip with the instance name mcSquare (see Figure 7). Because this movie clip doesn’t yet contain artwork, it cannot be seen on the Stage, but it does exist and appears as an item in this tree view. Both movie clips and text fields can appear in this area. Text fields appear only if they’re set as dynamic or input because they must have an instance name to belong to this list. Nested movie clips appear in hierarchical fashion.
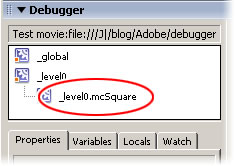
Figure 7. Movie clip in the Debugger panel
Properties and variables
Click the _level0.mcSquare branch of this tree view to focus on the mcSquare movie clip. Notice the Properties tab (see Figure 8); this location displays movie clip properties of the currently selected object.
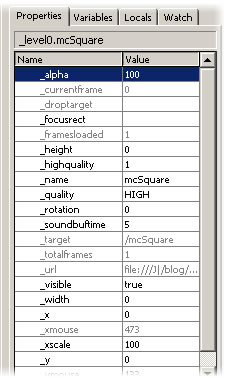
Figure 8. Movie clip properties in the Debugger panel
Note: Only movie clip properties are displayed in this area, even if the selected object is a text field. In the case of text fields, the displayed properties are those that text fields happen to share with movie clips.
If the selected movie clip has any variables declared in its Timeline, these will appear under the Variables tab. As it turns out, there are indeed a few declared in debugger_1.fla, so click the Variables tab to see them.
Select the _level0 branch to see properties or variables located in the main Timeline. The _global branch represents ActionScript’s special _global object, which can be used to store global variables available to any Timeline. Select this branch and look at the Variables tab to see variables located in this object.
Script navigation
It’s time to put some artwork into this visually empty movie clip. Three buttons at the top of the Debugger panel enable you to pilot your breakpoints: Step Over, Step In, and Step Out (see Figure 9).
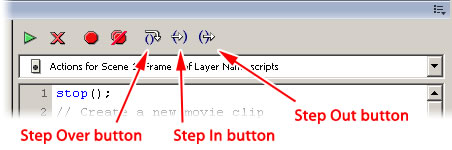
Figure 9. Script navigation buttons in the Debugger panel
The breakpoint on line 34 happens to sit next to a function. In order to step into this function, follow these steps:
-
Click the Step In button. This causes the Debugger panel to stop at each line of ActionScript code inside the function. The line under current review is indicated by a small yellow arrow (see Figure 10).
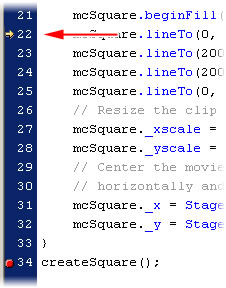
Figure 10. Stepping through ActionScript code in the Debugger panel
-
Click the Step In button repeatedly to advance from line to line, keeping an eye on the Stage as you do so. You will see a square being drawn, getting resized, and then being centered horizontally and vertically.
The useful part about watching these steps in slow motion is that if something goes wrong, you’ll know exactly which line caused the error.
- Close the SWF file for debugger_1.fla and select Control > Debug Movie to start again. This time, after clicking the Step In button a few times, click the Step Out button to leave the function. In a real-world debugging session, you’ll appreciate this ability to cancel a potentially tedious Step In procedure in the event you change your mind. Stepping Out takes you to the next breakpoint, if there is one.
- Close the SWF file again and select Control > Debug Movie one more time. When the SWF file stops at line 34, click the Step Over button to bypass the breakpoint altogether. This also takes you to the next breakpoint, if there is one.
Additional information
The Debugger panel provides a few additional tools whose usage may not be immediately apparent.
Locals tab
Variables in ActionScript are affected by scope, a kind of point of view that determines the availability of a variable to other parts of the code. If a variable is declared in the Timeline of a movie clip, that variable is available to any code in the rest of that movie clip’s Timeline. The variable is also available to other timelines, provided that they specify the instance name of the movie clip as a path to the variable.
Not all variables are so accessible. When a variable is declared inside a function, it is available only to other code inside the same function. Such a variable is said to be local to that function and is visible in the Debugger panel only in the Locals tab.
To see what I’m talking about, follow these steps:
- Open debugger_2.fla and select Control > Debug Movie.
- Use the pop-up menu to select the script in frame 1, set a breakpoint at line 12, and then click the Continue button to begin.
- Select the _level0 branch on the left side of the Debugger panel and click the Variables tab to note the existence of the
loopThisManyTimesvariable. - Click the Step In button to enter the
demoLocalVariable()function. - Click the Step In button again to execute line 8. At this point, the local variable
ihas been declared. - Click the Locals tab to see it and continue clicking the Step In button to watch the value of
iupdate (see Figure 11).
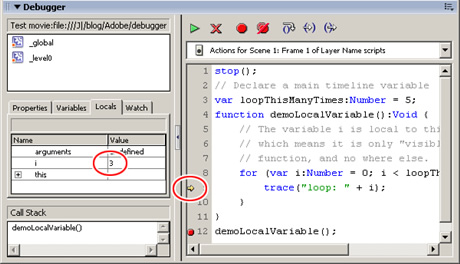
Figure 11. Locals tab in the Debugger panel
Watch tab
In an especially complex SWF file, the number of variables may be so high that the tab listings under Variables and Locals become unwieldy. In order to make your view less cluttered, you may want to handpick a collection of only those variables that interest you. You can add and remove these variables to the Watch tab for this very purpose. Right-click (Windows) or Control-click (Macintosh) a given variable to send it to the Watch tab. Repeat this process from the Watch tab to remove a variable from this listing.
Call stack
The bottommost pane of the Debugger panel, Call Stack, shows each function currently in execution. As a function begins, its name is added to the stack in this area and is removed again when the function concludes. In lengthy or complex SWF files, the Call Stack is a useful reminder of which function you’ve stepped into. It’s also good for keeping an eye on recursive functions, which can get out of control when written incorrectly.
Follow these steps:
- Open trace_xml.fla and select Control > Debug Movie.
- Use the pop-up menu to select the script in frame 1.
- Set a breakpoint at line 19 and click Continue to begin.
- Use the Step In button to enter the recursive function and watch while the Call Stack grows as the function is repeatedly invoked. If the stack grows to 256 items (this one doesn’t), the SWF file will output an error to the Output panel.
Comments