Debugging SWF files in a browser
Debugging SWF files in a browser
Debugging a SWF file from the comfort of Flash is one thing; debugging from the confines of a browser is another thing altogether! Fortunately, Flash offers a feature called remote debugging that makes browser-embedded SWF files available to the Debugger panel.
Remote debugging
To debug a SWF file remotely, you must first take care of a few prerequisites:
- Open remote_debugging.fla.
- Select File > Publish Settings, click the Flash tab, and place a check mark in the Debugging Permitted check box. You may provide an optional password here. If you do, you will be prompted for this password when the remote debugging session begins.
- To conclude your prep work, open the Debugger panel and select Enable Remote Debugging from the Options menu (see Figure 12).
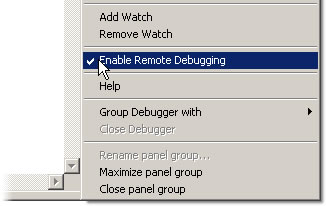
Figure 12. Enabling remote debugging in the Options menu of the Debugger panel
You must have Flash running in order to debug a browser-embedded SWF file, but it is not necessary to have the corresponding FLA file open:
- With Flash running, direct your browser to the web page that contains the SWF file you want to debug. You may launch a browser from Flash by selecting File > Publish Preview > HTML or by pressing F12 if you have the FLA file open. You’ll see a dialog box that asks you to identify yourself as localhost or another IP address. In most cases, localhost will do just fine (you would know if you needed to specify a particular IP address because you would have written your ActionScript code to expect one).
- Respond to this dialog box with localhost and then bring Flash to the forefront. You’ll see another dialog box in Flash—this time a password prompt. If you supplied a password earlier, enter it now and then click OK. If not, leave the password field blank and simply click OK.
- In the Debugger panel, select the script in frame 1, set a break point at line 3, and then press the Continue button to begin. You may now alternate between your browser and Flash to provide user interaction and debug as usual.
- Click the Click Me button in the SWF file to watch your Debugger Panel react.
Homemade Output panel
Unless you use remote debugging, trace() output simply isn’t visible from a browser-embedded SWF file. It is possible, however, to build a lightweight, makeshift Output panel out of a dynamic text field. To see one approach, open the homemade_output_panel.fla sample file that is part of the sample ZIP file that accompanies this article.

This FLA file contains one layer devoted just to the necessary dynamic text field. It’s positioned above all other visual content so that its output is always in sight. The dynamic text field is set to Multiline in the Property inspector and has Selectable and Show Border Around Text turned on. Finally, the text field is given the instance name tfOutput.
A function in frame 1 of the Scripts layer sets the TextField.text property of tfOutput to the incoming message. It also keeps the latest message on top by following the incoming message with a line break and then concatenating that with the previous content:
function traceOutput(msg:String):Void {
   tfOutput.text = msg + newline + tfOutput.text;
}
In this particular FLA file, you may now replace trace() with traceOutput() and use this new function in basically the same way. Sure, the homemade version isn’t as powerful but it works in a pinch when remote debugging is not an option.
Comments